Several organizations use different methods to track the pool building in the United States. These charts and graphic depictions come from the internal data of provider recommendation company Angi (formerly Angi’s List), and via Angi from www.PoolResearch.com.
Details provide food for thoughts, even though the basics are well known to those in the pool industry. California, Florida Texas and Arizona have the most installed pools. They contribute over four million units. This makes them the most competitive and fertile ground for retailers, builders and service companies. There’s no surprise.
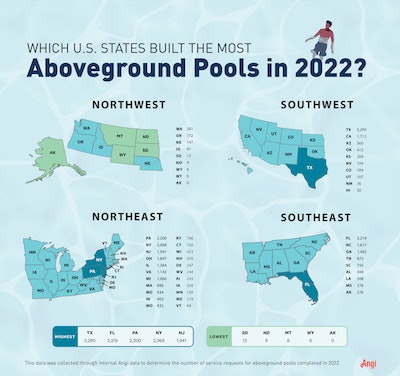
The states with the lowest number of pools installed are the ones with the shortest swimming seasons and low population density, such as the Dakotas, upper mountain states in the west and Alaska.
Northeastern states, with short swimming seasons such as New York or New Jersey, compensate for this lack of swimming months by having a high population density. They contribute a significant amount to the pool total.
In 2022 the Northeast will also be the center of aboveground pools sales. This is not surprising to anyone who knows the product and continues a long-standing trend. Aboveground pools are affordable, and the large population, local distribution and affordability have driven pandemic to new heights. As the graph above shows, Texas, Florida, and other states also played a major role in the growth of the category.
For more information, you can read the complete report by Angi. ( is available here). One last nugget is that the states where pool maintenance requests have grown the most rapidly since 2020 tend to be the ones with the lowest pool installation density. Iowa (147%) is one of them, as are Nebraska (633%) South Dakota (473%) and North Dakota (655%). There is definitely some money to be made in the service industry.